Final project: Week 5 Information of Nottingham
- t0292033
- Feb 22, 2021
- 2 min read
Updated: Apr 7, 2021
For continuing my final project research, I collected different information about Nottingham to help me to recognize the situation of the city. These research inspired me to consider which types of pavilion that I want to design.
Demographic of Nottingham:

figure.1 population of Nottingham(2021)
According to the diagram of Nottingham's population, it express the increasing number since 1950 to 1960 about 640.9k to 688.6k. But, the population decreased from 688.6k to 599.2k, the statistics started to increasing from 1990 to 2021, Nottingham occupy a huge numbers of population that affect the local community.
About the population, Nottingham accommodate approximately 700 thousand of people which include different countries. In 2011, White British and BME (not White British are respectively 65.4% and 34.7% which is occupied most in Nottingham demographic. Although, the people other races such as Chinese, African and other Asian were possessed a few percentages in the population rate of Nottingham. Other White and Paskistanian have 5.1% and 5.5%. Many immigration and students concentrate in Nottingham to make it becomes a diversity and one of the biggest increase city. (World Population Review, Nottingham Demographics, 2011)
Population in UK
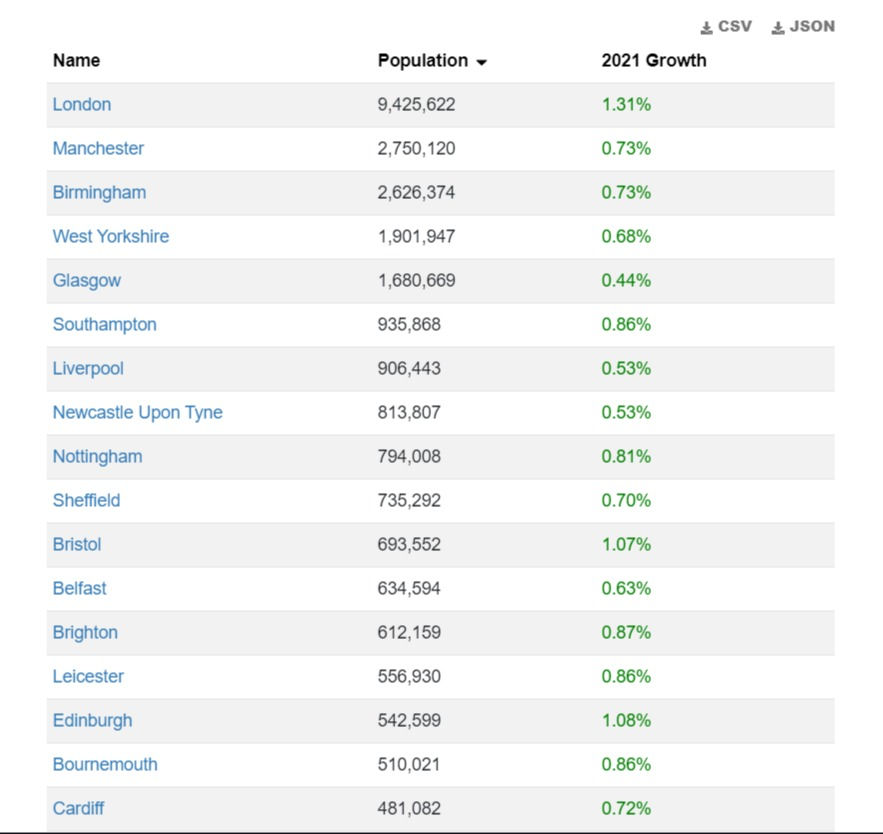
figure.2
The overall of population rate in the United Kingdom has increased significantly. Among the three highest population of city in the UK, capital of the UK, London was grew to 1.31% that reached about 9.4 million. Manchester and Birmingham increased 0.73%. The comparison between the population in Nottingham and Manchester and Birmingham, Nottingham was growing 0.81% in 2021, the statistics expressed that the percentage of Nottingham population growth is higher than other two big city in the UK.
Changes in Nottingham from 2011 to 2021
The graphic of Nottingham population below:

figure.3 Nottingham Population Data (Urban Area)
The numbers of Nottingham from 2011, there were accommodate about 730 thousand people. After few years, the percentages of growth rate was keep in a same level, the average of growth number between 5000 and 6000. In latest ten years, the statistics showed that many student and immigrate aspect to arrive to Nottingham.
Nottingham


figure.4 Nottingham street view


Comments